

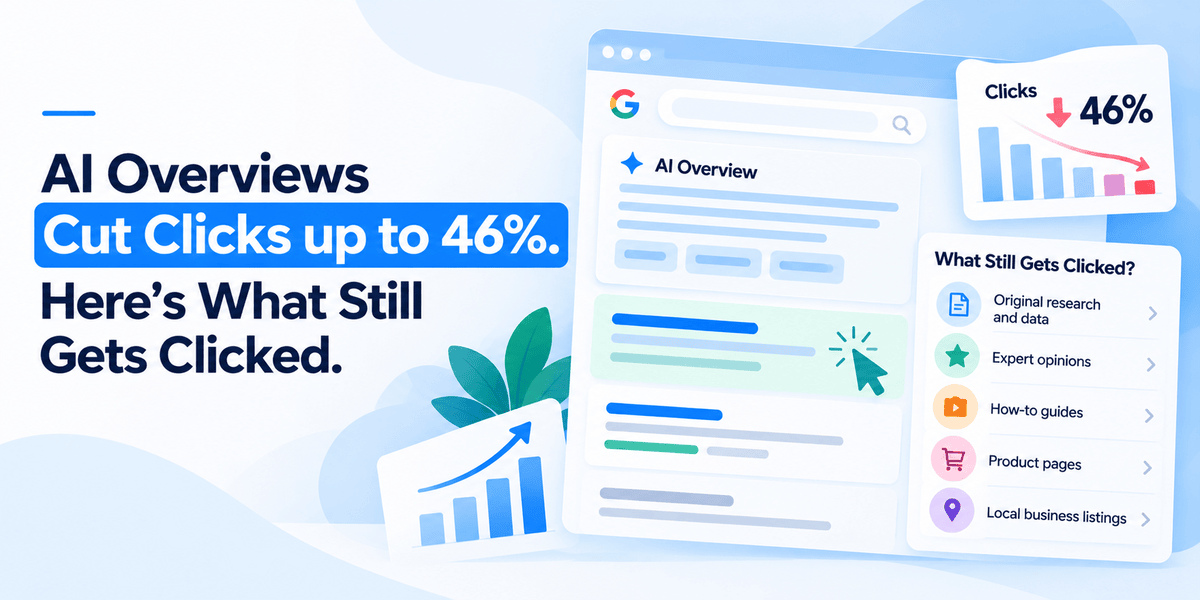
AI Overviews cut click-through rate by 46.7% when they appear. But they appear on only about 13% of Google searches, and the lost traffic has not vanished evenly. Branded queries actually gained 18%. Transactional searches barely trigger an Overview at all. And brands cited inside an Overview earn 120% more clicks per impression than brands that are not.
The decline is real, and it is uneven
The headline numbers are not in dispute. Pew Research tracked 68,000 queries and found users click a traditional result 8% of the time when an AI Overview is present, against 15% when it is not — a 46.7% relative drop. Ahrefs measured position-one click losses between 34.5% and 58%. Similarweb recorded zero-click searches rising from 56% to 69% in a single year.
Those numbers describe what happens when an AI Overview appears. They do not describe the average search.
As of mid-2026, roughly 13% of all Google queries trigger an AI Overview. So the accurate reading is not that search traffic halved. It is that one specific slice of search traffic fell sharply, while the rest carried on largely unchanged. Knowing which slice you sit in is the entire question.
Where do AI Overviews actually appear?
Trigger rates vary enormously by what the searcher is trying to do.
Search intent | AI Overview trigger rate | What that means for you |
|---|---|---|
Informational | 36–39% | The exposed category. “What is”, “how does”, “why do”. |
Commercial | ~22% | Rising fast. Comparison and research queries before a purchase. |
Transactional | ~16% | Largely protected. Buy, book, hire, near me. |
Navigational | ~12% | Least affected. Someone looking for you by name. |
Long-form informational (7+ words) | 65.9% | The single most exposed bucket measured. |
Source: Presenc AI research, May 2026. The clearest single predictor is query length — long, question-shaped searches are the ones AI Overviews were built to answer.
Industry matters just as much.
Vertical | AI Overview coverage | Change |
|---|---|---|
Healthcare | 88% | Up from 72% |
Education | 83% | Up from 18% — a 361% rise in a year |
B2B technology | 82% | Up from 36% |
Restaurants | 78% | Up from 10% |
E-commerce | ~4% | Down from 29% |
Source: Omnibound, 2026.
Google is covering research, not purchase
Put two findings side by side and a pattern appears.
Between November 2025 and April 2026, the share of commercial-intent search results carrying an AI Overview grew 71%. Finance rose 231%. Computers and electronics rose 108%. Meanwhile transactional searches declined 5%, and e-commerce coverage fell from 29% to roughly 4%.
Google is putting AI Overviews on the research phase and keeping them off the buying phase. Whatever the reasoning, the practical consequence is straightforward: the closer a query sits to a transaction, the less likely an AI Overview is to sit between you and the click.
So what still gets clicked?
Four things, in rough order of how much they are worth defending.
- Branded searches. When an AI Overview appears on a branded query, click-through rate rises 18%. This is the clearest signal in the entire dataset and it points somewhere uncomfortable for most content strategies: the searches that still convert are the ones where the person already knows who you are. The Overview confirms rather than replaces.
- Citations inside the Overview. Brands cited within an AI Overview earn 120% more organic clicks per impression than uncited brands on the same query. This is the most underrated number in the data. Being named inside the answer matters more than your ranking position underneath it. A site at position six that gets cited will outperform a site at position one that does not.
- Transactional queries. A 16% trigger rate, and around 4% in e-commerce. If your page targets somebody ready to buy, book or call, AI Overviews are largely not your problem, and the effort is better spent elsewhere.
- Anything a summary cannot deliver. Pricing quotes, appointment booking, account access, calculators, live inventory, personalized results. A paragraph of generated text is not a substitute for the thing itself, and Google knows it.
What loses
Generic informational content, especially long question-shaped queries, in high-coverage verticals. If you publish what-is and how-does explainers in healthcare, education, B2B technology or hospitality, that traffic is going, and no amount of optimization brings it back in its old form.
That is worth stating plainly, because a lot of content strategies were built entirely on that model. The honest response is not to optimize those pages harder. It is to accept that the format has been absorbed and move the budget.
What to do instead
Three shifts, in order.
Move spend from generic explainers toward branded demand and bottom-funnel commercial content. The data says both still earn clicks. Generic informational content increasingly does not.
Optimize to be cited rather than to rank beneath. Given the 120% figure, a page that gets named inside the Overview is worth more than a higher-ranked page that does not. That means extractable claims, clear entity signals and third-party corroboration.
Audit your own keywords rather than trusting the averages. Industry coverage figures are useful for orientation and useless for planning. Here is the whole method:
- Export your top 50 queries by impressions from Search Console.
- Run each one in a logged-out browser and record whether an AI Overview appears.
- Note whether you are cited in the ones that do.
- Sort your pages into three buckets: exposed and uncited, exposed and cited, not exposed.
That takes an afternoon and tells you exactly which pages are at risk, which are already working, and which you can leave alone. It is more useful than any industry benchmark in this article.
The honest caveat
Thirteen percent coverage means the majority of searches are still unaffected. Anyone telling you search is over is overstating it.
But coverage is climbing fast. Education went from 18% to 83% in a year. Restaurants went from 10% to 78%. The sensible posture is to plan for expansion into your vertical rather than react to the coverage that exists today.
We publish this kind of analysis monthly
We track AI Overview coverage, citation rates and what the numbers mean for US businesses, and send a short summary once a month. No pitch, just what changed.
Frequently Asked Questions
How much do AI Overviews reduce click-through rate?
By 46.7% in relative terms where they appear. Pew Research tracked 68,000 queries and found users click a traditional result 8% of the time with an AI Overview present, against 15% without. Ahrefs measured position-one losses between 34.5% and 58%.
What percentage of Google searches show an AI Overview?
Roughly 13% of all queries as of mid-2026. Coverage varies sharply by intent: informational queries trigger an Overview 36–39% of the time, commercial around 22%, transactional around 16%, and navigational around 12%. Long informational questions of seven words or more trigger one about 65.9% of the time.
Which searches still get clicks despite AI Overviews?
Branded searches, which gained 18% click-through rate. Transactional queries, which trigger an Overview only about 16% of the time. Pages offering something a summary cannot replace, such as booking, pricing quotes or calculators. And any brand cited inside the Overview itself.
Does being cited in an AI Overview help traffic?
Substantially. Brands cited inside an AI Overview earn 120% more organic clicks per impression than uncited brands on the same query. Being named within the answer matters more than ranking position beneath it — a cited page at position six can outperform an uncited page at position one.
Which industries are worst affected by AI Overviews?
Healthcare at 88% coverage, education at 83%, B2B technology at 82%, and restaurants at 78%. E-commerce is the outlier at roughly 4%, down from 29%, because Google largely keeps AI Overviews off transactional queries.
Should I stop publishing informational content?
Not entirely, but generic explainers in high-coverage verticals are a poor investment now. Long question-shaped queries trigger an Overview 65.9% of the time. Shift budget toward branded demand, bottom-funnel commercial content, and making existing pages citable rather than publishing more of the absorbed format.